EFK Compose

Docker Logging Efk Composeで、docker-composeを使ったELKスタックの例がある。

docker-compsoe.yml

1
2
3
4
5
6
7
8
9
10
11
12
13
14
15
16
17
18
19
20
21
22
23
24
25
26
27
28
29
30
31
32
33
34
35
36
37
38
39
40
41
42
version: '2'
services:
web:
image: httpd
ports:
- "8080:80"
links:
- fluentd
logging:
driver: "fluentd"
options:
fluentd-address: "localhost:24224"
fluentd-async-connect: "false"
tag: httpd.access
depends_on:
- fluentd

fluentd:
build: ./fluentd
volumes:
- ./fluentd/conf:/fluentd/etc
links:
- "elasticsearch"
ports:
- "24224:24224"
- "24224:24224/udp"

elasticsearch:
image: elasticsearch:7.12.0
expose:
- 9200
ports:
- "9200:9200"

kibana:
image: kibana:7.12.0
links:
- "elasticsearch"
ports:
- "5601:5601"
depends_on:
- elasticsearch

fluentd/conf/fluent.conf

1
2
3
4
5
6
7
8
9
10
11
12
13
14
15
16
17
18
19
20
21
22
23
24
# fluentd/conf/fluent.conf
<source>
@type forward
port 24224
bind 0.0.0.0
</source>
<match *.**>
@type copy
<store>
@type elasticsearch
host elasticsearch
port 9200
logstash_format true
logstash_prefix fluentd
logstash_dateformat %Y%m%d
include_tag_key true
type_name access_log
tag_key @log_name
flush_interval 1s
</store>
<store>
@type stdout
</store>
</match>

fluentd/Dockerfile

1
2
3
# fluentd/Dockerfile
FROM fluent/fluentd:latest
RUN gem install fluent-plugin-elasticsearch --no-rdoc --no-ri

ElasticSeearchがcode78でエラーになる!?

EKF Composeを起動すると、ElasticSearchがcode 78エラーで停止してしまう。
least one of [discovery.seed_hosts, discovery.seed_providers, cluster.initial_master_nodes] must be configuredというメッセージが出ている

discoveryの設定が必要

このパラメーターはElastickSearchクラスタに関する設定
ElasticSearch7.X系以降はこの設定が必須になっているようだ。

パラメーター 意味
discovery.seed_hosts 設定ベースのseed_hosts
discovery.seed_providers ファイルベースのseed_hosts
cluster.initial_master_nodes クラスターのマスターノード
1
2
3
4
5
6
7
8
9
10
11
12
13
14
elasticsearch_1  | {"type": "server", "timestamp": "2021-08-15T01:00:46,290Z", "level": "INFO", "component": "o.e.n.Node", "cluster.name": "docker-cluster", "node.name": "93ed1cfad299", "message": "initialized" }
elasticsearch_1 | {"type": "server", "timestamp": "2021-08-15T01:00:46,290Z", "level": "INFO", "component": "o.e.n.Node", "cluster.name": "docker-cluster", "node.name": "93ed1cfad299", "message": "starting ..." }
elasticsearch_1 | {"type": "server", "timestamp": "2021-08-15T01:00:46,309Z", "level": "INFO", "component": "o.e.x.s.c.PersistentCache", "cluster.name": "docker-cluster", "node.name": "93ed1cfad299", "message": "persistent cache index loaded" }
elasticsearch_1 | {"type": "server", "timestamp": "2021-08-15T01:00:46,406Z", "level": "INFO", "component": "o.e.t.TransportService", "cluster.name": "docker-cluster", "node.name": "93ed1cfad299", "message": "publish_address {192.168.32.2:9300}, bound_addresses {0.0.0.0:9300}" }
elasticsearch_1 | {"type": "server", "timestamp": "2021-08-15T01:00:46,524Z", "level": "INFO", "component": "o.e.b.BootstrapChecks", "cluster.name": "docker-cluster", "node.name": "93ed1cfad299", "message": "bound or publishing to a non-loopback address, enforcing bootstrap checks" }
elasticsearch_1 | ERROR: [1] bootstrap checks failed. You must address the points described in the following [1] lines before starting Elasticsearch.
elasticsearch_1 | bootstrap check failure [1] of [1]: the default discovery settings are unsuitable for production use; at least one of [discovery.seed_hosts, discovery.seed_providers, cluster.initial_master_nodes] must be configured
elasticsearch_1 | ERROR: Elasticsearch did not exit normally - check the logs at /usr/share/elasticsearch/logs/docker-cluster.log
elasticsearch_1 | {"type": "server", "timestamp": "2021-08-15T01:00:46,535Z", "level": "INFO", "component": "o.e.n.Node", "cluster.name": "docker-cluster", "node.name": "93ed1cfad299", "message": "stopping ..." }
elasticsearch_1 | {"type": "server", "timestamp": "2021-08-15T01:00:46,556Z", "level": "INFO", "component": "o.e.n.Node", "cluster.name": "docker-cluster", "node.name": "93ed1cfad299", "message": "stopped" }
elasticsearch_1 | {"type": "server", "timestamp": "2021-08-15T01:00:46,557Z", "level": "INFO", "component": "o.e.n.Node", "cluster.name": "docker-cluster", "node.name": "93ed1cfad299", "message": "closing ..." }
elasticsearch_1 | {"type": "server", "timestamp": "2021-08-15T01:00:46,569Z", "level": "INFO", "component": "o.e.n.Node", "cluster.name": "docker-cluster", "node.name": "93ed1cfad299", "message": "closed" }
elasticsearch_1 | {"type": "server", "timestamp": "2021-08-15T01:00:46,572Z", "level": "INFO", "component": "o.e.x.m.p.NativeController", "cluster.name": "docker-cluster", "node.name": "93ed1cfad299", "message": "Native controller process has stopped - no new native processes can be started" }
ekf-stack_elasticsearch_1 exited with code 78

マスターノードのみ設定する

複数台構成ではないので、マスターノードのみ設定する。

1
2
3
4
5
6
7
8
elasticsearch:
image: elasticsearch:7.12.0
expose:
- 9200
ports:
- "9200:9200"
environment:
- cluster.initial_master_nodes=elasticsearch

code 78はでなくなったがmaster not discovered yet,というメッセージが…

1
elasticsearch_1  | {"type": "server", "timestamp": "2021-08-15T01:56:08,340Z", "level": "WARN", "component": "o.e.c.c.ClusterFormationFailureHelper", "cluster.name": "docker-cluster", "node.name": "64a558eac1e4", "message": "master not discovered yet, this node has not previously joined a bootstrapped (v7+) cluster, and this node must discover master-eligible nodes [elasticsearch] to bootstrap a cluster: have discovered [{64a558eac1e4}{2UB6bFD4QUSAu9rXFwZFhw}{q72ZliAYQOq5r_Zq7-vFxw}{172.19.0.2}{172.19.0.2:9300}{cdfhilmrstw}{ml.machine_memory=8348790784, xpack.installed=true, transform.node=true, ml.max_open_jobs=20, ml.max_jvm_size=4177526784}]; discovery will continue using [127.0.0.1:9300, 127.0.0.1:9301, 127.0.0.1:9302, 127.0.0.1:9303, 127.0.0.1:9304, 127.0.0.1:9305] from hosts providers and [{64a558eac1e4}{2UB6bFD4QUSAu9rXFwZFhw}{q72ZliAYQOq5r_Zq7-vFxw}{172.19.0.2}{172.19.0.2:9300}{cdfhilmrstw}{ml.machine_memory=8348790784, xpack.installed=true, transform.node=true, ml.max_open_jobs=20, ml.max_jvm_size=4177526784}] from last-known cluster state; node term 0, last-accepted version 0 in term 0" }

ElasticSearch自体の応答はある。

ElasticSearch width=640

標準のノード名がランダムな値となっているので、ノード名とクラスター名を明示的に設定する。

1
2
3
4
5
6
7
8
9
10
elasticsearch:
image: elasticsearch:7.12.0
expose:
- 9200
ports:
- "9200:9200"
environment:
- node.name=es-node
- cluster.name=es-cluster
- cluster.initial_master_nodes=es-node

設定後に各ポートにアクセスすると

ElasticSearch

ElasticSearch(localhost:9200)にアクセスすると、設定したノード名やクラスター名が表示されている。

ElasticSearch width=640

Kibana

Kibana(localhost:5601)へアクセスするとKibanaのUIが表示される。

Kibana width=640

Kibana width=640

Fluent-bitからがElasticSearchにせつぞくできていない・・・Faraday::Error::ConnectionFailed

正常にログが転送されると、KibanaのIndexManagementにfluentd-YYYYMMDDの形式でインデックスが登録される。
しかし、インデックスが存在しない状態…ログを確認すると、以下のエラーが出ている。

1
2
3
fluentd_1        | 2021-08-15 03:12:14 +0000 [warn]: #0 failed to flush the buffer. retry_time=13 next_retry_seconds=2021-08-15 04:17:15 +0000 chunk="5c98f797a0fdcfe5f8155507b4d141b4" error_class=NameError error="uninitialized constant Faraday::Error::ConnectionFailed"
fluentd_1 | 2021-08-15 03:12:14 +0000 [warn]: #0 suppressed same stacktrace
fluentd_1 | 2021-08-15 03:12:14.571214000 +0000 fluent.warn: {"retry_time":13,"next_retry_seconds":"2021-08-15 04:17:15 +0000","chunk":"5c98f797a0fdcfe5f8155507b4d141b4","error":"#<NameError: uninitialized constant Faraday::Error::ConnectionFailed>","message":"failed to flush the buffer. retry_time=13 next_retry_seconds=2021-08-15 04:17:15 +0000 chunk=\"5c98f797a0fdcfe5f8155507b4d141b4\" error_class=NameError error=\"uninitialized constant Faraday::Error::ConnectionFailed\""}

fluent.confではコンテナ名を指定する

いろいろ思考錯誤した結果、fluent.confのhostではコンテナ名を明示する必要がある。

1
2
3
4
5
6
7
8
9
10
11
12
13
14
15
16
17
18
19
20
21
22
23
24
# fluentd/conf/fluent.conf
<source>
@type forward
port 24224
bind 0.0.0.0
</source>
<match *.**>
@type copy
<store>
@type elasticsearch
host es-node
port 9200
logstash_format true
logstash_prefix fluentd
logstash_dateformat %Y%m%d
include_tag_key true
type_name access_log
tag_key @log_name
flush_interval 1s
</store>
<store>
@type stdout
</store>
</match>

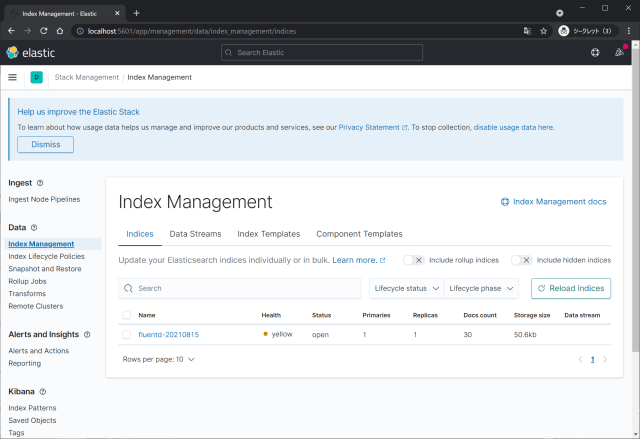
Kibanaでインデックスるが作成されている

ログインすると前とは異なりいきなりログイン後画面に。

Kibana width=640

左上のメニューからStack Managemetを選択。

Kibana width=640

Index Managementを選択。fluentd-YYYYMMDDの形式でインデックスが登録されている。

Kibana width=640